Unpacking Segment self-service churn
April 2022
Background
The Segment self-service team had begun to notice an increase in churn among older workspaces that had seemed to be well-activated by current measures — and the current churn survey and analytics were not helping them understand the situation. They reached out to the research team to help them understand the churn trends, and help develop better processes to measure churn in the future.
Methods
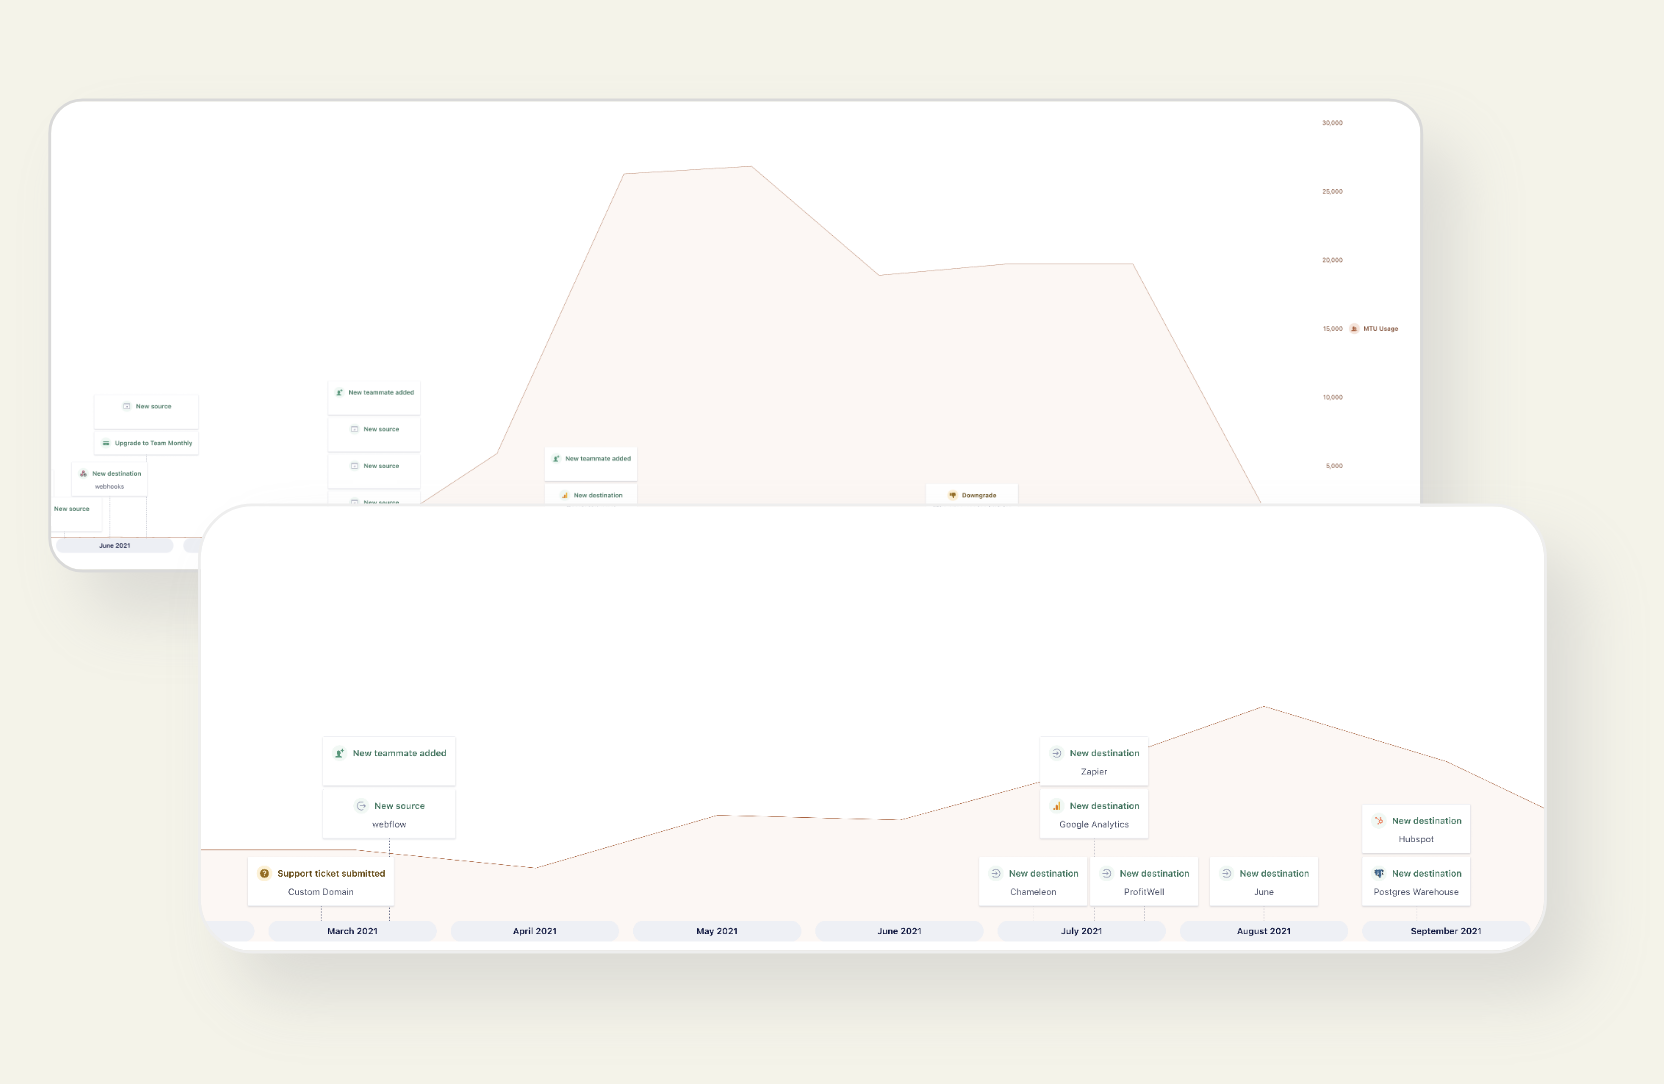
To gather rich feedback about churned customers’ experiences, I interviewed 10 churned customers who belonged to the higher-rate group
For each participant, I created “timeline” that illustrated the product analytics events we had captured over the account lifetime
During the interviews, we used the timeline as a reference point and unpacked what was actually going on with that customer at each point (and what we were missing)
After the interviews, I collaborated with the Product Manager, Designer, and Product Marketing Manager to develop churn “red flags” and define situations where certain patterns in in-app analytics events might actually mean a customer is about to churn
Outcomes
This project found both low-hanging fruit to reduce churn (such as an improved account handoff process when a key owner leaves) as well as more strategic challenges that needed the team’s attention. I also developed a revised churn survey that gave our team a much better look into why customers were churning, and contributed to an overarching strategic conversation about challenges with Segment’s pricing and packaging.
Want more? Get in touch to see my full résumé and portfolio.